Ag Charts
The Ag Charts component allows you to display a chart using the Ag Charts library.
The following section details Ag Charts component's specific settings. For more details on the App editor, check the dedicated documentation or the App editor Quickstart:
The configuration is divided into two parts: X-axis data and an array of datasets. Each dataset hold the data for the Y-axis and the configuration for the plot (type, color, etc).
Configuration
| Name | Type | Connectable | Templatable | Default | Description |
|---|---|---|---|---|---|
| X-axis data | json | true | false | [1, 2, 3, 4] | Horizontal axis values or labels that are used to plot the data points on a chart. |
Dataset
For each dataset, you can specify the data for the Y-axis and the configuration for the plot (type, color, etc). If you want to have an eval for every data point, you can switch to JSON mode. There can be several datasets.
| Name | Type | Connectable | Templatable | Default | Description |
|---|---|---|---|---|---|
| Name | string | false | false | Dataset 1 | The name of your dataset. |
| Data | 'Bar', 'Line' , 'Scatter' , 'Area' ,'Range Bar' (EE) | false | false | 'Bar' | The type of chart. |
Depending on the type of chart, you can configure the following properties:
Bar, line, scatter, area
| Name | Type | Connectable | Templatable | Default | Description |
|---|---|---|---|---|---|
| value | number[] | false | false | [25,25,50] | The values of the bar. |
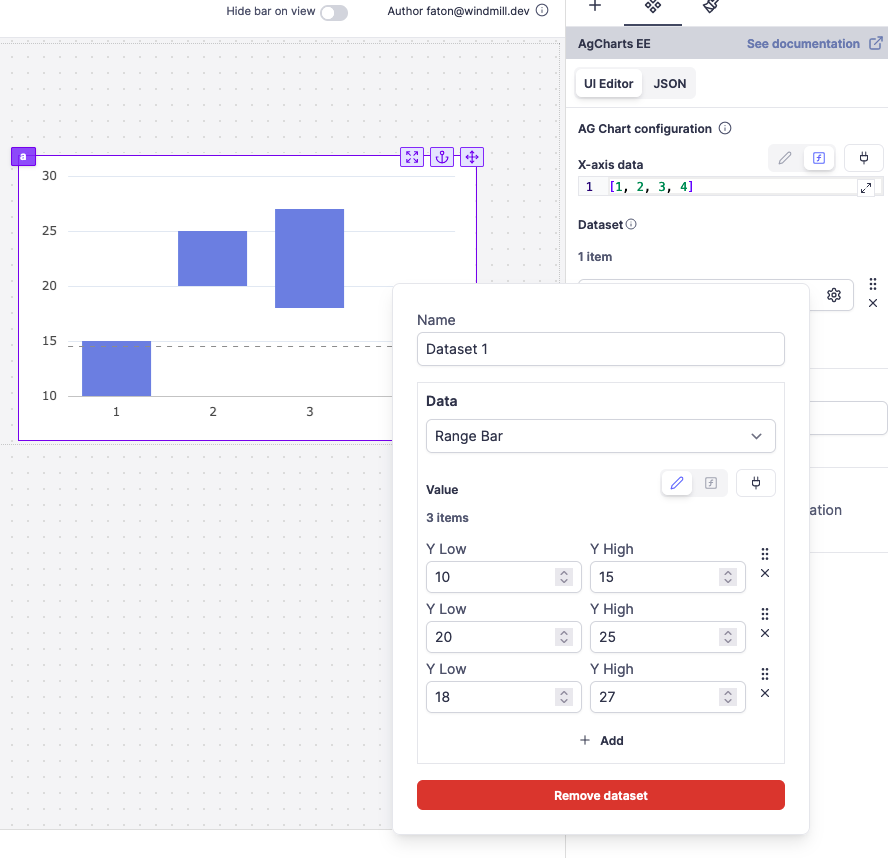
Range Bar (EE)
| Name | Type | Connectable | Templatable | Default | Description |
|---|---|---|---|---|---|
| value | number[][] | false | false | [[25, 50], [25, 50], [50, 75]] | The values of the bar. |

Dynamically Configure AgGrid
You can use scripts and connect them to the dataset, settings or Column Definitions of your AgGrid component to dynamically configure it.
For example, you can control the cellStyle, or whether it's editable.
def main():
    return [
        {
            "field": "id",
            "flex": 1,
            "cellStyle": {"color": "blue", "background-color": "lightblue"},
        },
        {"field": "name", "editable": True, "flex": 1},
        {"field": "age", "flex": 1},
    ]
For example, you can control the cellStyle, whether it's editable. Here the first column has a lightblue bg, and the second one is editable.
AgCharts EE
You have to provide a valid license key to use AgCharts EE (Enterprise Edition). You can find more information about AgCharts EE here.